Batch Spreadsheet for C Programmers
Richard Perry
Villanova University
Department of Electrical and Computer Engineering
richard.perry@villanova.edu
http://vecr.ece.villanova.edu/
---
Outline
- Brief History of Computer Spreadsheets
- Starting from scratch
- Why batch processing?
- Example with GUI Front-End and Post-Processing
- Convergence, Cycles, and Plots
- Development
- Functions and Extensions
- Conclusion
---
Brief History of Computer Spreadsheets
- Historical - batch
- Spreadsheet Computer Output, by Richard Mattessich, 1964
Input was data and FORTRAN program
- Modern - interactive
- Visicalc, by Dan Bricklin and Bob Frankston, 1979
SC, original by James Gosling, 1982
Lotus 1-2-3, by Mitch Kapor, 1983
Excel for Macintosh, by Microsoft, 1985
Quattro Pro, by Borland, 1987
Oleo (1992) and Gnumeric, from the GNU Project, 1998
OpenOffice, from StarOffice and Sun, 2000
---
Starting from scratch
- Innovation - enable anything that seems reasonable
- Not hampered by requiring Excel compatibility
Example: 8 basic ways to traverse a region
- Start at any one of the 4 corners
- Traverse by rows or by columns
- For printing, evaluating, copying, filling, etc.
---
8 ways to traverse a region
a0:b1 = { 1, 2, 3, 4}; print; print bycols;
plot a0:b1; plot b1:a0; plot b0:a1; plot a1:b0;
bycols;
plot a0:b1; plot b1:a0; plot b0:a1; plot a1:b0;

~A       B               0       1
0       1       2       A       1       3
1       3       4       B       2       4

~1       2               1       3
~3       4               2       4

~4       3               4       2
~2       1               3       1

~2       1               2       4
~4       3               1       3

~3       4               3       1
~1       2               4       2
---
Starting from scratch...
- Design for C programmers
- C Syntax - operators, comments, macros, etc.
- User-defined functions - written in C
- Symbol Table - constants and user-defined variables
- Cyclic Dependencies Allowed
- Batch Processing
---
Why go back to batch processing?
---
Spreadsheet Example
Input:
a0:d0 = { "grade", "score", "avg", "stdev"};
mean=avg(b1:b5); c1=mean; d1=stdev(b1:b5);
a1=80+15*(b1-mean)/$d$1; copy a2:a5 a1:a4;
b1:b5 = { 57, 67, 92, 87, 76 }; eval;
print symbols values formulas pointers;
Output:
mean = avg(B1:B5) = 75.8                   (symbols)

~A       B       C       D
0       grade   score   avg     stdev
1       60.29   57.00   75.80   14.31
2       70.77   67.00
3       96.98   92.00                      (values)
4       91.74   87.00
5       80.21   76.00
---
Spreadsheet Example...
~A                         B        C      D
0       "grade"                   "score"  "avg"  "stdev"
1       80+((15*(B1-mean))/$D$1)  57       mean   stdev(B1:B5)
2       80+((15*(B2-mean))/$D$1)  67
3       80+((15*(B3-mean))/$D$1)  92       (formulas)
4       80+((15*(B4-mean))/$D$1)  87
5       80+((15*(B5-mean))/$D$1)  76

~A       B       C       D
0       1051348 1051380 10513b8 10513f0
1       10517a8 0       10514d0 1051578
2       10517a8 0
3       10517a8 0                          (pointers)
4       10517a8 0
5       10517a8 0
---
Spreadsheet GUI Front-End and Post-Processing
User can only edit the batch input file, not the spreadsheet display.
---
Cycles and Convergence
- If a cell depends on itself, that forms a cycle
- Spreadsheet may not converge when evaluated
- Can be used to implement iterative algorithms
Example: Newton's method to find the square root of x:
x = 2; a0 = b0 ? b0 : x/2; b0 = (a0+x/a0)/2;
Since a0 depends on b0, and b0 depends on a0, there is a cycle.
Newton's method converges quickly:
ss_eval: converged after 7 iterations

    A                    B
0   1.41421356237309492  1.41421356237309492
---
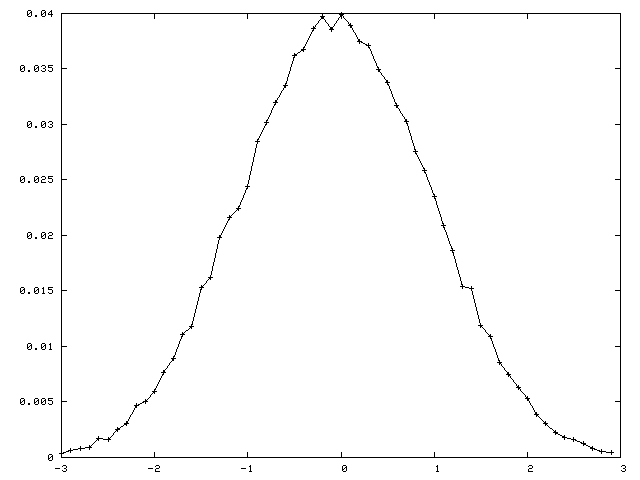
Monte-Carlo Example
Test the distribution of nrand values
- using 60 counters over the range -3 to 3
- with 50000 samples (iterations)
- Note: does not converge
sample = nrand(); ++trials; fill a1:a61 -3, 0.1;
c1 += (sample>=a1)&&(sample<a2) ? 1 : 0;
b1 = c1/trials; copy b2:c60 b1:c59;
eval c1:b60 50000; plot a1:b60;

---
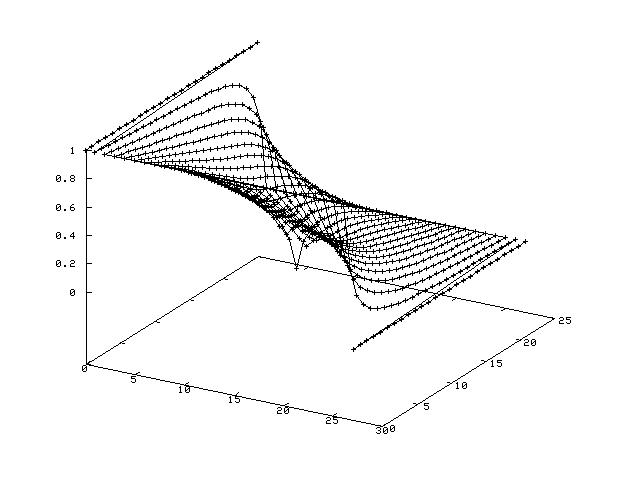
Finite Element Example

---
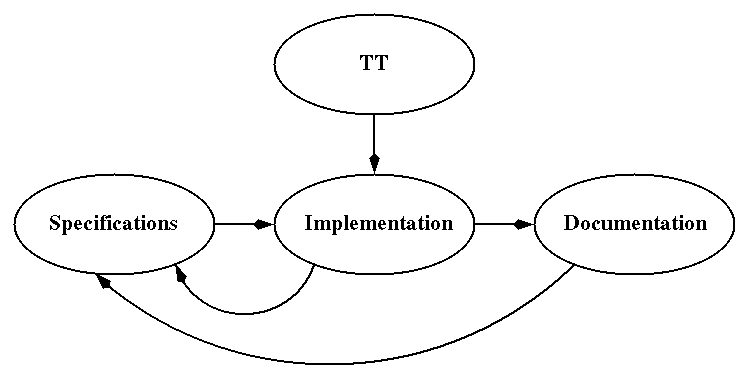
Development
Implementation derived from Truth-Table precursor
ttfill a0:c7;
d0 = a0 && b0 || a0 && c0 || b0 && c0;
e0 = majority(a0,b0,c0);
copy d1:e7 d0:e6; eval; format "%g"; print values;

~A       B       C       D       E
0       0       0       0       0       0
1       0       0       1       0       0
2       0       1       0       0       0
3       0       1       1       1       1
4       1       0       0       0       0
5       1       0       1       1       1
6       1       1       0       1       1
7       1       1       1       1       1
---
Development...
Specifications heavily influenced by process of writing documentation

---
Functions
- All of the functions from C's math.h
- rand(), irand(), drand(), nrand(), ...
- Range functions: avg, min, max, ...
- User-defined functions - written in C, dynamically linked
---
Extensions
Must be able to add new functions easily
Gnumeric contains 520 functions
SS internal or user-defined function example, irand.c:
/* 1 pseudo-random integer, 0<=irand(i)<=i-1
*/
double nf_irand(const Node *n, const Cell *c)
{
~int i = eval_tree( Right(n), c);

~return (int) (i*(rand()/(RAND_MAX+1.0)));
}
---
Conclusion


