7. Summary
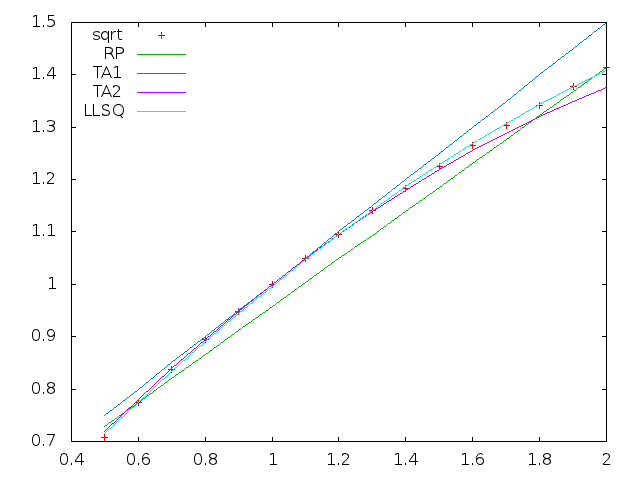
The following table shows the mean square error (represented by the norm ||err||, the square-root of the sum of the squares of the errors) and the maximum absolute error for each of the approximations discussed above:
| RP1 | TA1 | TA2 | LLSQ | MinMax | |
|---|---|---|---|---|---|
| ||err|| | 0.1301 | 0.1516 | 0.0586 | 0.0138 | 0.0147 |
| max|err| | 0.0469 | 0.0858 | 0.0392 | 0.0075 | 0.0049 |
Code: input (in VECR/SS/ sqrt_approximations.ss), output, plot script
Combined plot:
