For a given hypothesis
![]() let
Jm = Tmi(K) + Fmi(K), where
Tmi(K) is the number of
measurement vectors at time m used in the Ktrack set
let
Jm = Tmi(K) + Fmi(K), where
Tmi(K) is the number of
measurement vectors at time m used in the Ktrack set
![]() and
Fmi(K) is the number of
false alarms. Here we assume that
and
Fmi(K) is the number of
false alarms. Here we assume that
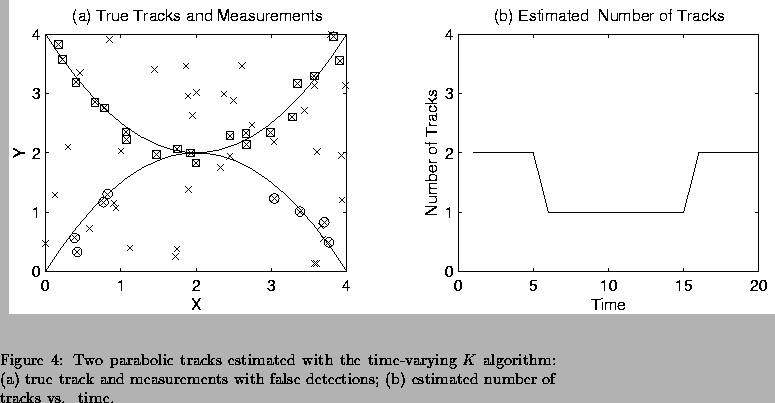
We have demonstrated [7] how, with proper selection of the list length L in conjunction with merging and pruning, the Viterbi MHT algorithm can recover form a diverged track after several missed detections. We also show that Viterbi MHT can generate lists of track-set estimates, each with a close to optimum cost, so that if other information becomes available the track-set that is most consistent can be selected. Here we focus on number-of-track estimation. Four sets of simulation results are presented here. For the first two, we assume the number of tracks is fixed over the processing. For the last two we use the Viterbi MHT algorithm which allows for variation in the number of tracks.
First we conducted a Monte Carlo
simulation to compare the joint K/track estimator
(referred to below as the MAP estimator) and the marginalization estimator.
K=2 tracks were simulated which were linear in the ![]() and
and
![]() position values values. N=500 trials were conducted, with
n=6 measurement times per trial. Gaussian measurement noise
was added to each target measurement. The number of
``false detect'' events was generated using a
Poisson distribution with a false alarm rate of 2, and the false detections
themselves were generated using a uniform distribution over the range
[0,4] in both
position values values. N=500 trials were conducted, with
n=6 measurement times per trial. Gaussian measurement noise
was added to each target measurement. The number of
``false detect'' events was generated using a
Poisson distribution with a false alarm rate of 2, and the false detections
themselves were generated using a uniform distribution over the range
[0,4] in both ![]() and
and ![]() .
Probability of a missed detection was assumed to be 0.3.
Kmax=3 and L=16.
Figure 2 shows estimator performance for varying
maesurement and model noise variance. On the basis of these simulations,
it can be concluded that estimation by marginalization can be advantageous
over MAP estimation. Note, however, that this advantage is not significant
for all scenarios. The advantage is more pronounced with limited data
situations.
.
Probability of a missed detection was assumed to be 0.3.
Kmax=3 and L=16.
Figure 2 shows estimator performance for varying
maesurement and model noise variance. On the basis of these simulations,
it can be concluded that estimation by marginalization can be advantageous
over MAP estimation. Note, however, that this advantage is not significant
for all scenarios. The advantage is more pronounced with limited data
situations.
Second, Monte Carlo simulations were run to study K estimator performance
for varying probability of detection Pd. N=100 trials were run per Pd
value. K=2 linear tracks were simulated, with n=21 measurement times.
Measurement noise variance was 0.01.
A Poisson distribution with a false alarm rate of 1
was used for the number of false detections, and the false detections
themselves were generated using a uniform distribution over the range
[0,4] in both ![]() and
and ![]() .
Kmax = 3 and L=32 were used.
Table 1 shows the percentages for different estimates of K vs. Pd.
.
Kmax = 3 and L=32 were used.
Table 1 shows the percentages for different estimates of K vs. Pd.
|
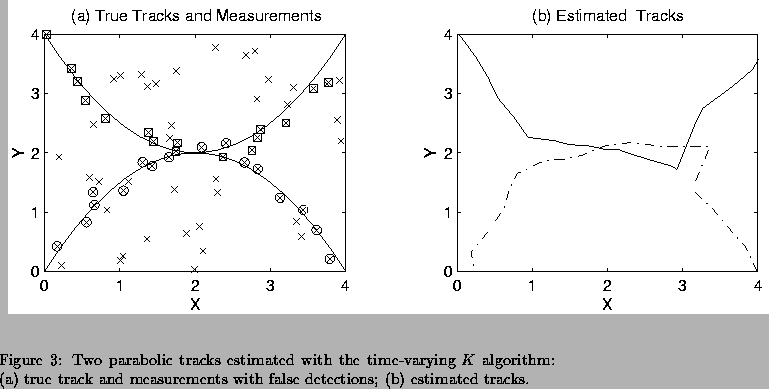
For the fourth simulation two parabolic target tracks consisting of
n=20 ![]() and
and ![]() position values were again generated, where
position values were again generated, where
![]() varied linearly over time from
varied linearly over time from
![]() to
to
![]() .
This time, one target was turned off over the middle 10 measurement times.
Again, Gaussian measurement noise with a variance of 0.01 was
added to the target tracks. The number of
``false detect'' events was generated using a
Poisson distribution with a false alarm rate of 2, and the false detections
themselves were generated using a uniform distribution over the range
[0,4] in both
.
This time, one target was turned off over the middle 10 measurement times.
Again, Gaussian measurement noise with a variance of 0.01 was
added to the target tracks. The number of
``false detect'' events was generated using a
Poisson distribution with a false alarm rate of 2, and the false detections
themselves were generated using a uniform distribution over the range
[0,4] in both ![]() and
and ![]() .
Probability of a missed detection was assumed to be 0.2.
Kmax=3 and L=8. We partitioned the data into 4 blocks of T=5measurement times.
Figure 4(a) shows the
.
Probability of a missed detection was assumed to be 0.2.
Kmax=3 and L=8. We partitioned the data into 4 blocks of T=5measurement times.
Figure 4(a) shows the ![]() and
and ![]() position
values for the true tracks (solid lines), along with the noisy measurements
(boxed and circled x's) and false alarms (x's) used as input to the algorithm.
This time the algorithm correctly detected two tracks for the first and
last block, and one track for the middle two
(i.e.
position
values for the true tracks (solid lines), along with the noisy measurements
(boxed and circled x's) and false alarms (x's) used as input to the algorithm.
This time the algorithm correctly detected two tracks for the first and
last block, and one track for the middle two
(i.e.
![]() ,
,
![]() ).
Figure 4(b) shows
).
Figure 4(b) shows ![]() vs. time.
vs. time.